The Daily Light Integral (DLI) is the number of PAR photons that land on a place in one day. We can get a reasonable approximation by measuring the foot-candle reading at one spot every hour throughout the day.
DLI is like the temperature – each day will be different but you want to get an average based on the time of year, which will ultimately give you a quantitative/better answer to the question “how much light is my plant getting?” At the end of this article, I’ll include a link that will address the question “how much light does THIS plant need?” – and I’ll throw in my two cents to help houseplant owners make sense of the numbers!
Method
This is essentially what we’re doing:
- Measure the light intensity (in foot-candles or PPFD) at regular intervals throughout the day (traditionally measured every hour)
- Convert foot-candles to PPFD (if necessary: you won’t need to do this if you already measured PPFD using a PAR meter)
- Calculate DLI from daily average PPFD
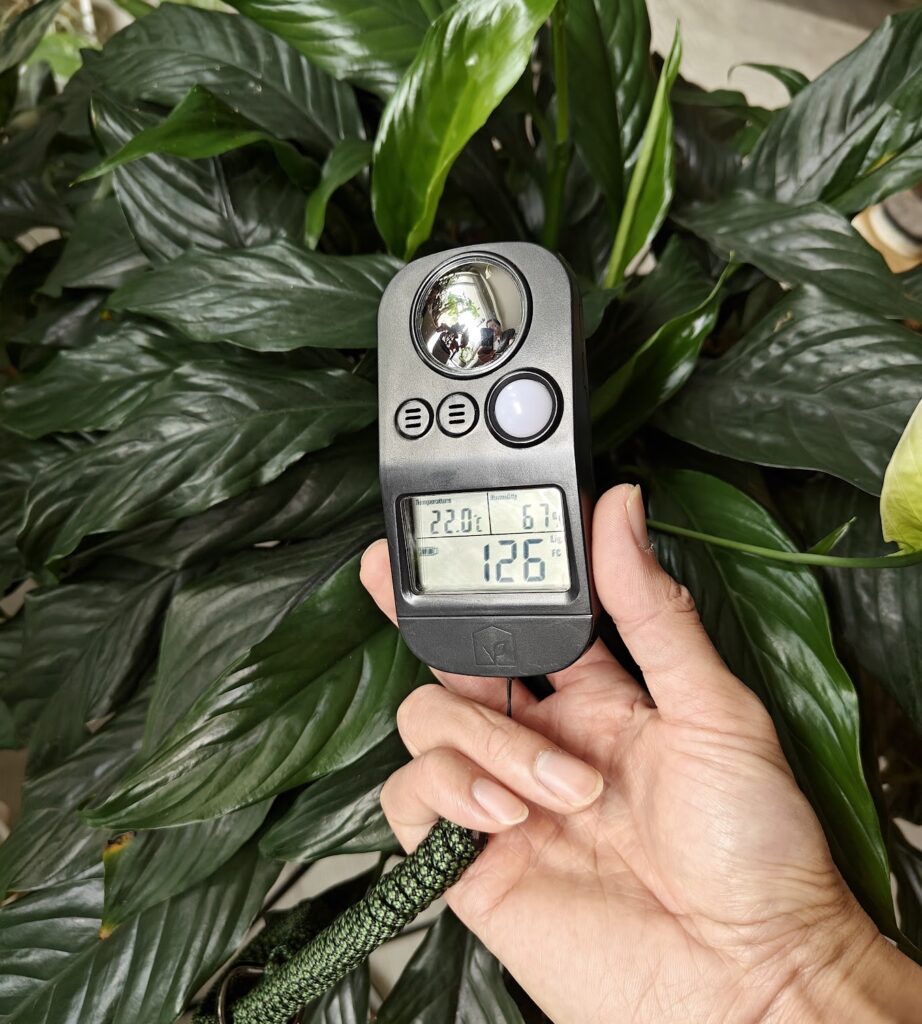
Get the LTH Meter: measuring light, temperature and humidity
So now, here’s the actual work
On a clear day, I took foot-candle measurements at the spot where my Peace Lily (Spathiphyllum) lives.
- Light meter direction: it must point straight up in order to make a meaningful comparison with the documented values.
- I wasn’t home the entire day but I managed to get several readings at critical times of the day: early morning, mid morning, during the time when there is direct line of sight with the sun, during the time when the sun is just barely hidden behind some buildings.
- I guessed the values between the actual readings because nothing would throw off the estimates that much…unless someone had a mirror that was positioned in such way that it reflected the sun for a specific hour that I wasn’t aware of.
Here are the readings (foot-candles vs. hour of the day):
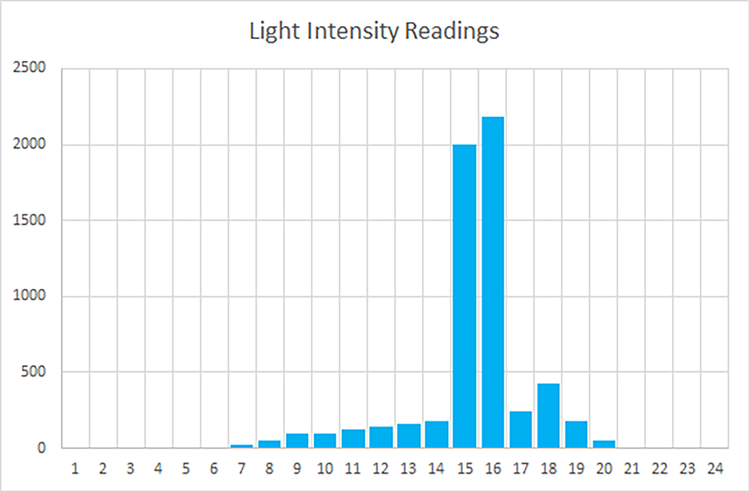
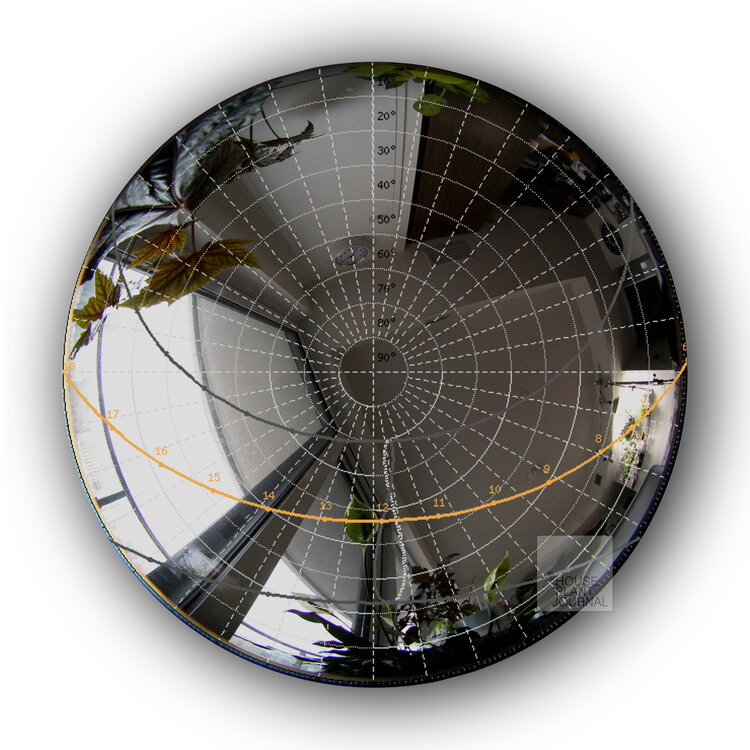
Great! So what is the DLI from this? Let’s calculate…
Here’s the raw data:

Take the average intensity over the whole day: (add up all the numbers and divide by 24)
248 foot-candles
Convert foot-candles to PPFD: the conversion factor for sunlight is 0.20 so let’s multiply 248 x 0.20 to get…
49.625 μmol/(m²⋅s)
FYI: μmol/(m²⋅s) reads as “micromoles of PAR photons per square meter per second”
But to get DLI, we want to know how many moles of PAR photons we’ll get in a whole day. This can be done by converting micromoles to moles (divide by 1,000,000) and seconds to day (multiply by 86,400 seconds in a day). Effectively multiply by 0.0864, which gives us:
4.29 mol/(m²⋅d)
So we can say that on a clear day on September 22 in Toronto SPECIFICALLY at the spot where my Peace Lily lives, that plant gets 4.29 moles of PAR photons for that day. I purposely chose to do the measurement near the equinox to get a median DLI, knowing that it would be higher in the summer and lower in the winter.
Now here’s the fun part, looking up what plants would do well at that spot:
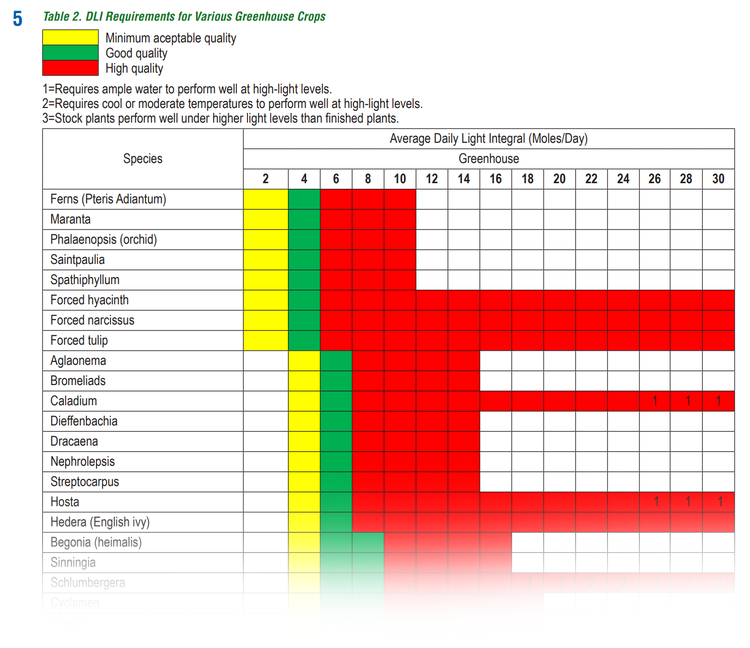
A caveat to using this chart is that these measurements were taken at a greenhouse, which means the light sensor would be pointed straight up and the ceiling has diffusion material, which spreads the sun’s light evenly all around. So even though my DLI reading is in the “Good quality” range for Spathiphyllum, I shouldn’t expect growth exactly like at the greenhouse. A window, even a very large one, is still surrounded by other walls and a ceiling, which are opaque.
On the other hand, the aesthetic standards are for COMMERCIAL growers where they have time constraints (i.e. get the plants to grow to sellable size as fast as possible). As casual plant parents, we do not need to get this level of growth to be HAPPY with our plants.
But what if I put a plant some distance from a small north-facing window? You might measure something like this:
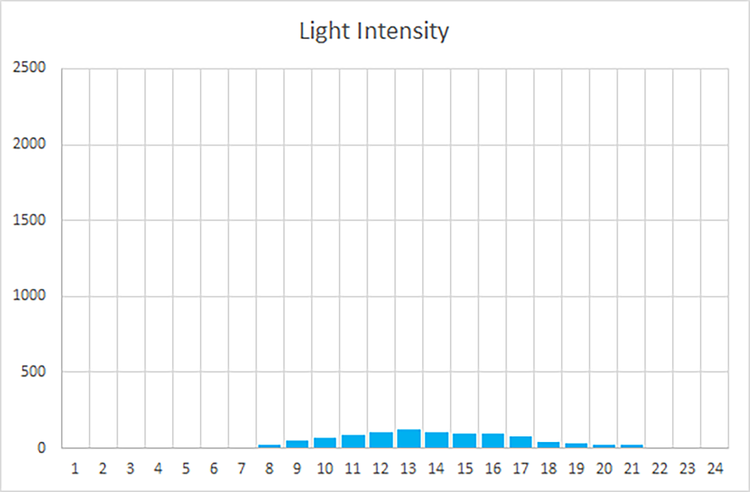
The DLI from this place would be: 0.69 mol/(m²⋅d); well below the “Minimum acceptable quality” for the even lowest light plants.
So here’s where grow lights come to the rescue…here’s a handy set of TABLES!
Affiliate links: As an Amazon Associate I earn from qualifying purchases. Thank you for supporting the work of House Plant Journal: The Sensible Approach to Houseplant Care.
LTH Meter: (designed by me!) https://www.houseplantjournal.com/product/lth-meter/
Dr. Meter (clunky orange light meter): https://amzn.to/317tUqu
PAR meter: https://amzn.to/2A3j88Q

